Case study
ERG Provides Clarity When Fields and OCT are Inconclusive
by Michael Cymbor, OD, FAAO
Glaucoma suspects often present a challenge, and this case is no different. When a patient with existing DR was referred for suspected glaucoma, optometrist Mike Cymbor, OD, FAAO, began with visual fields, OCT, and OCT-A. When those tests failed to provide conclusive results, Dr. Cymbor reached for his RETeval® handheld ERG and the objective, functional data it provides, which ultimately allowed him to make a glaucoma diagnosis months earlier than would have been possible without ERG.
Watch the video of Dr. Cymbor presenting his case or review the case below.
Patient History
A 59-year-old Caucasian female was referred to our clinic as a glaucoma suspect with mild non-proliferative diabetic retinopathy. Her corneal compensated IOP (CcIOP) was 22 OD and 24.7 OS with a reported TMax of 24 and 26.3. Her pachymetries according to the Ocular Hypertension Treatment Study (OHTS) were in the thick range at 612 and 613. She’s had type 2 diabetes for 11 years, hypertension for 5 years, and hypercholesterolemia for 6 years. Her medications included losartan, metformin, insulin, and simvastatin. She also reported a family history of cataracts, glaucoma, diabetes, and hypertension.
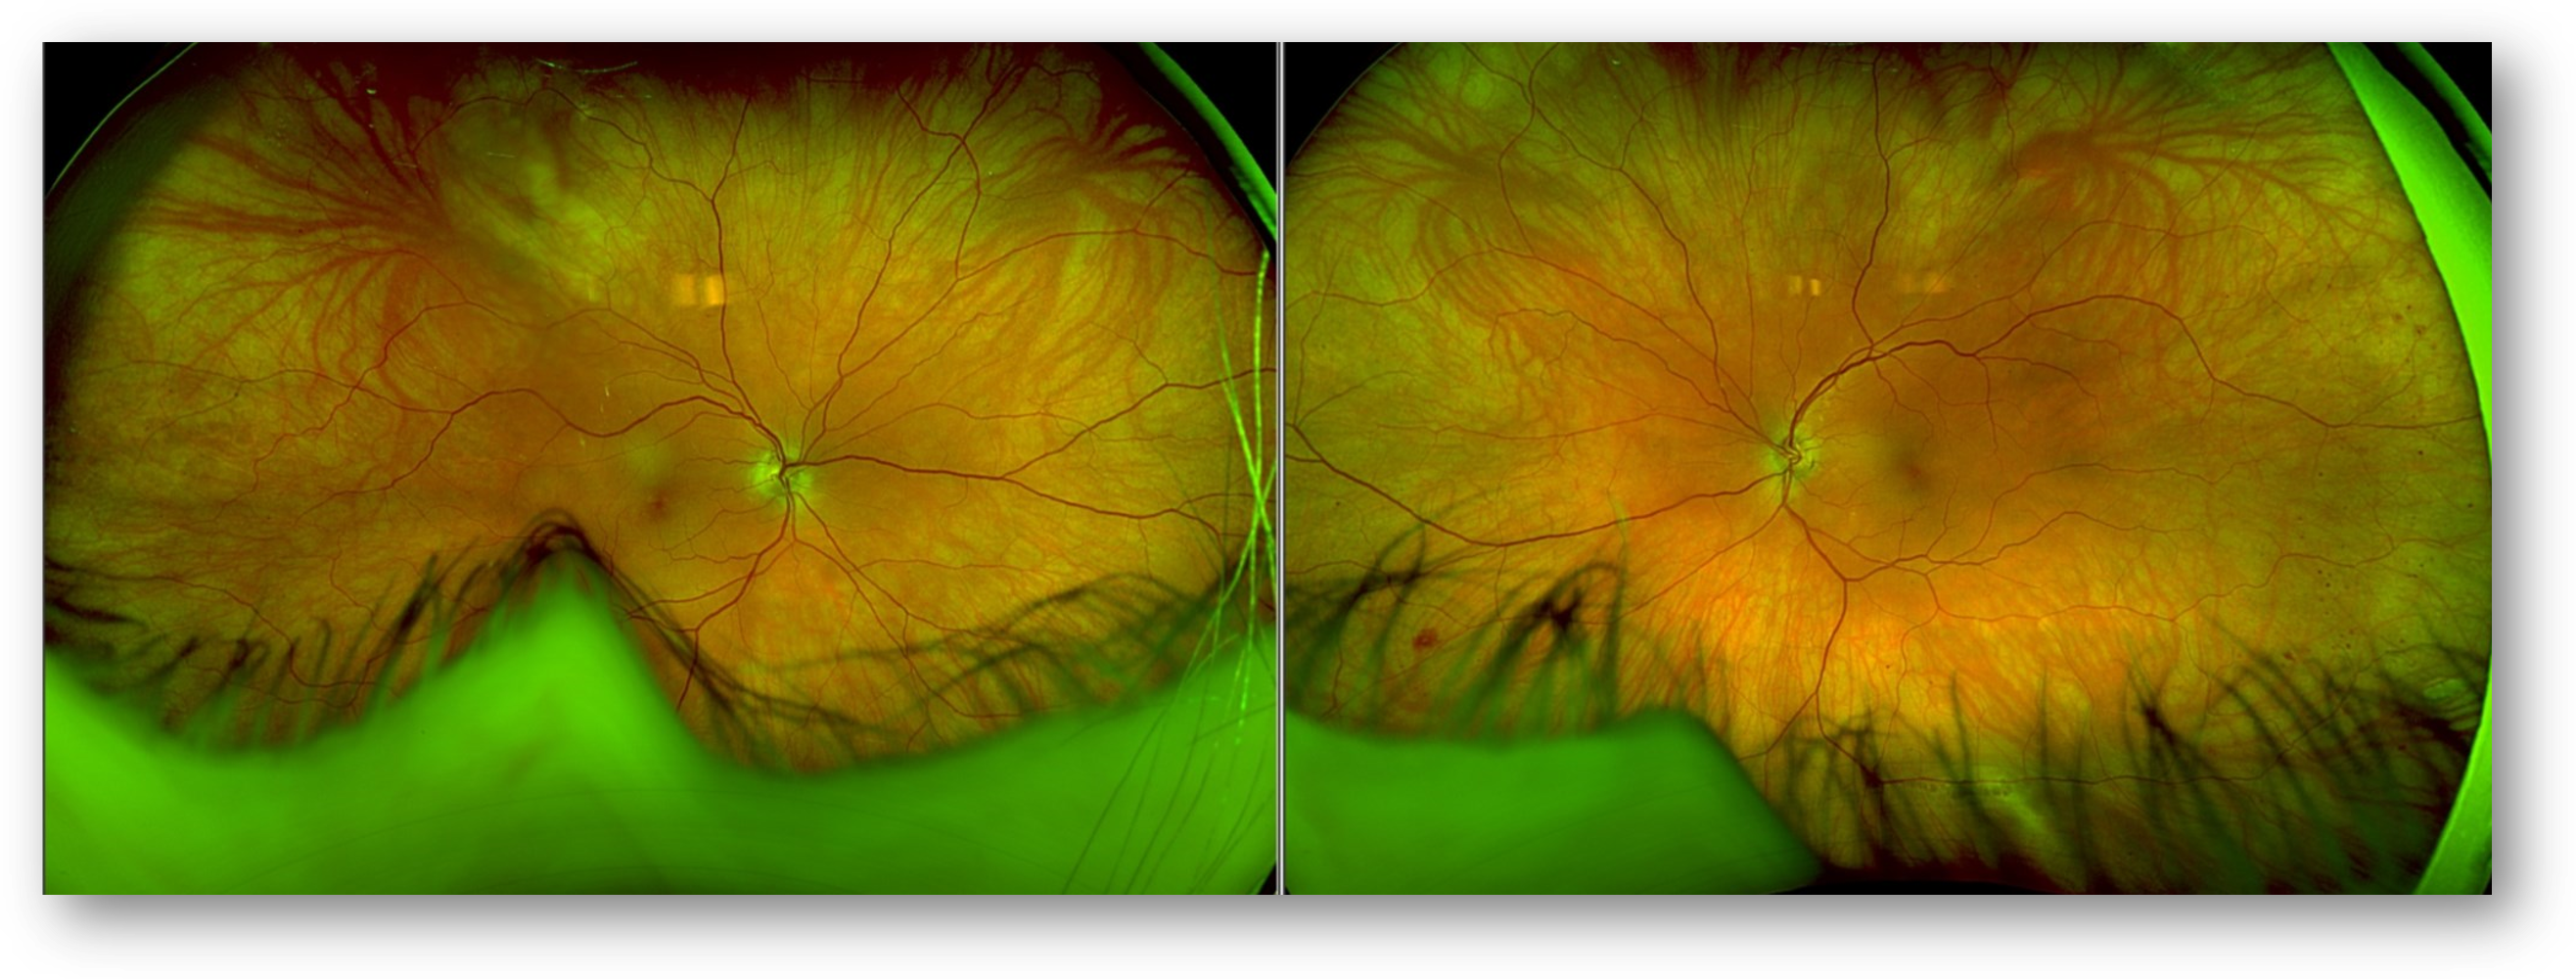
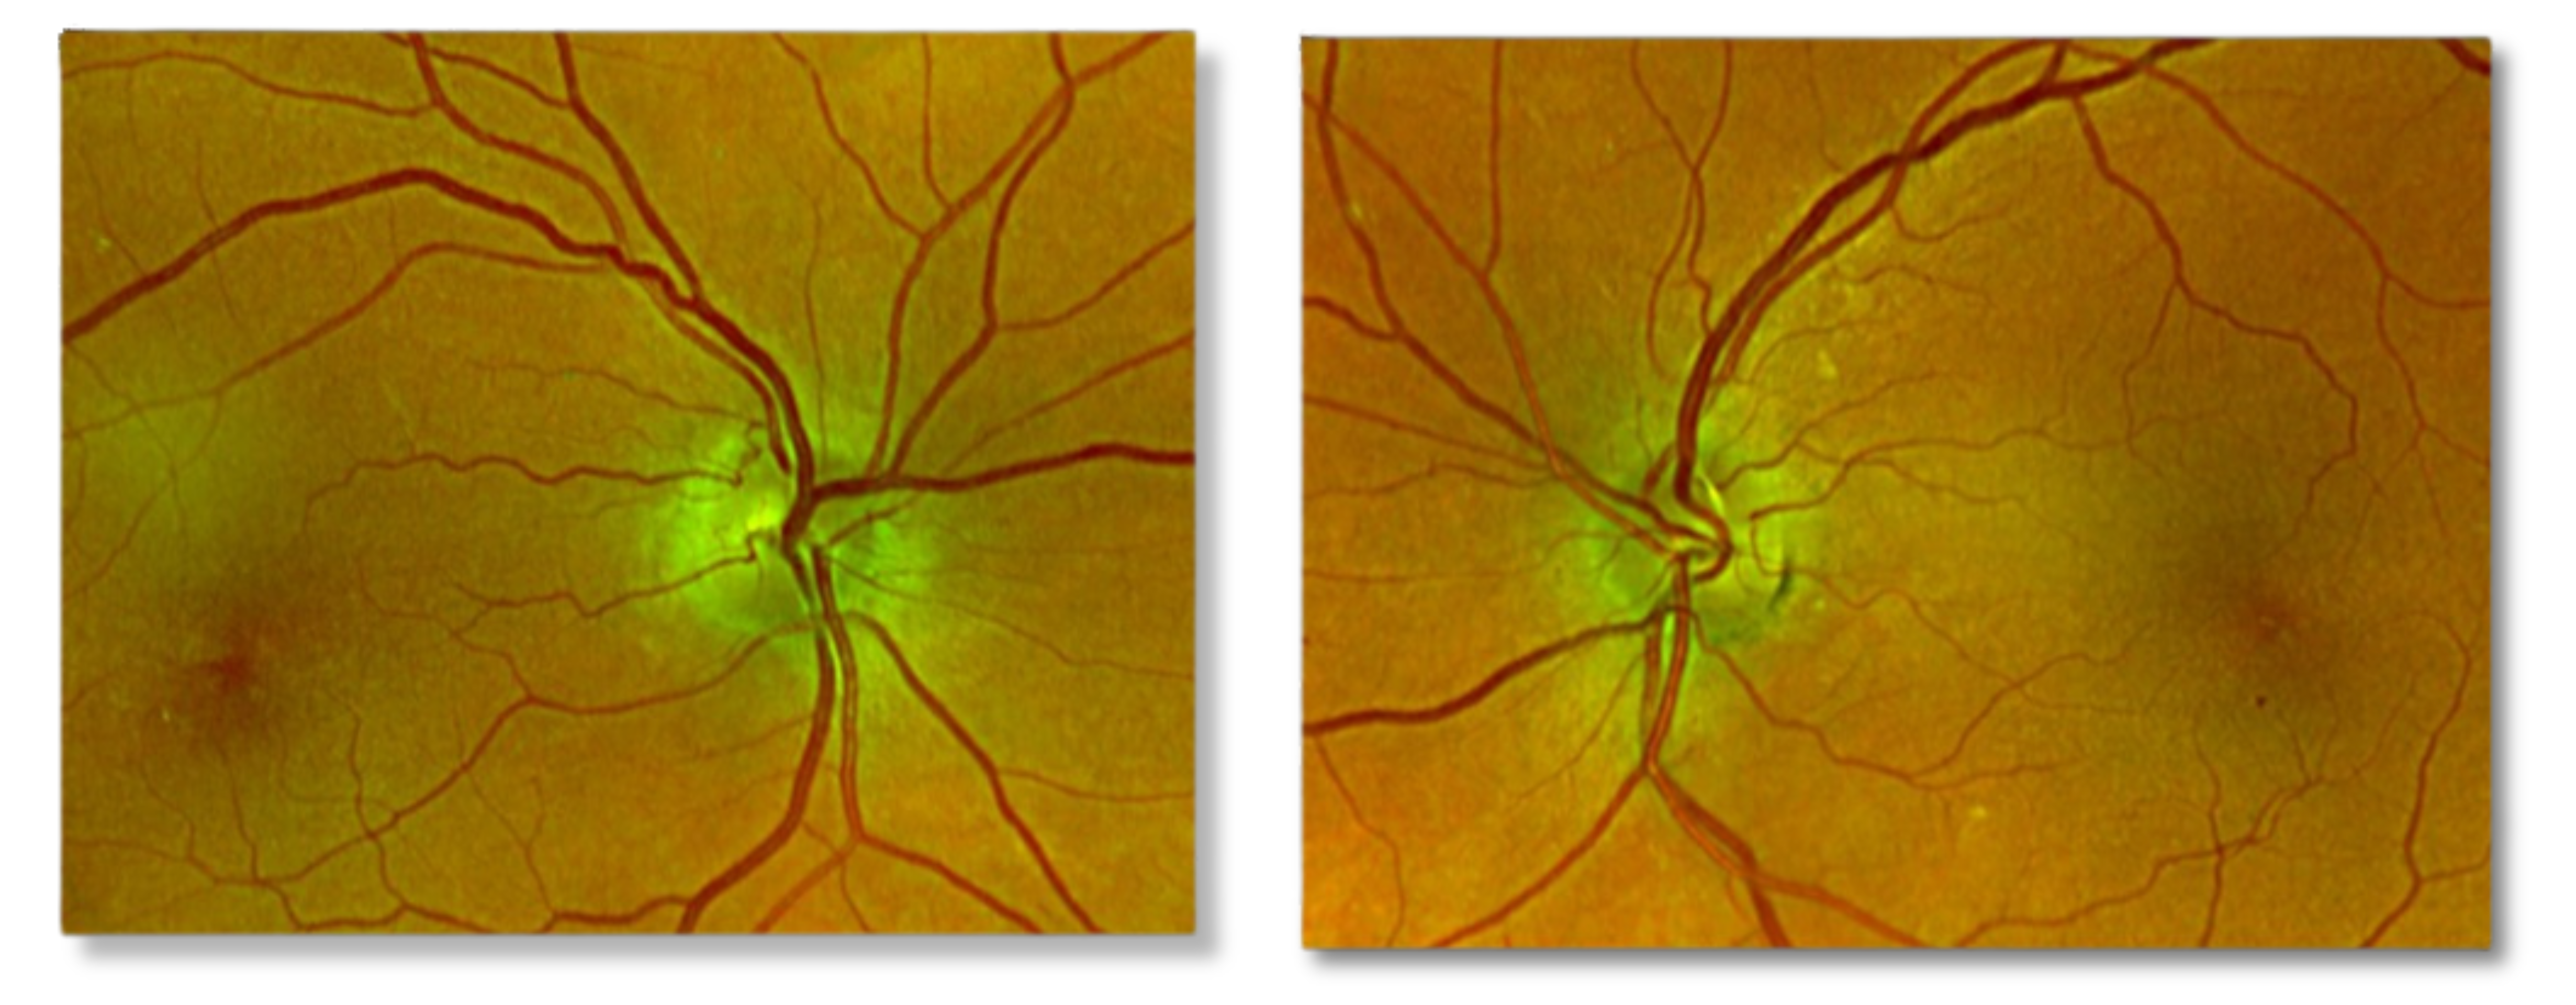
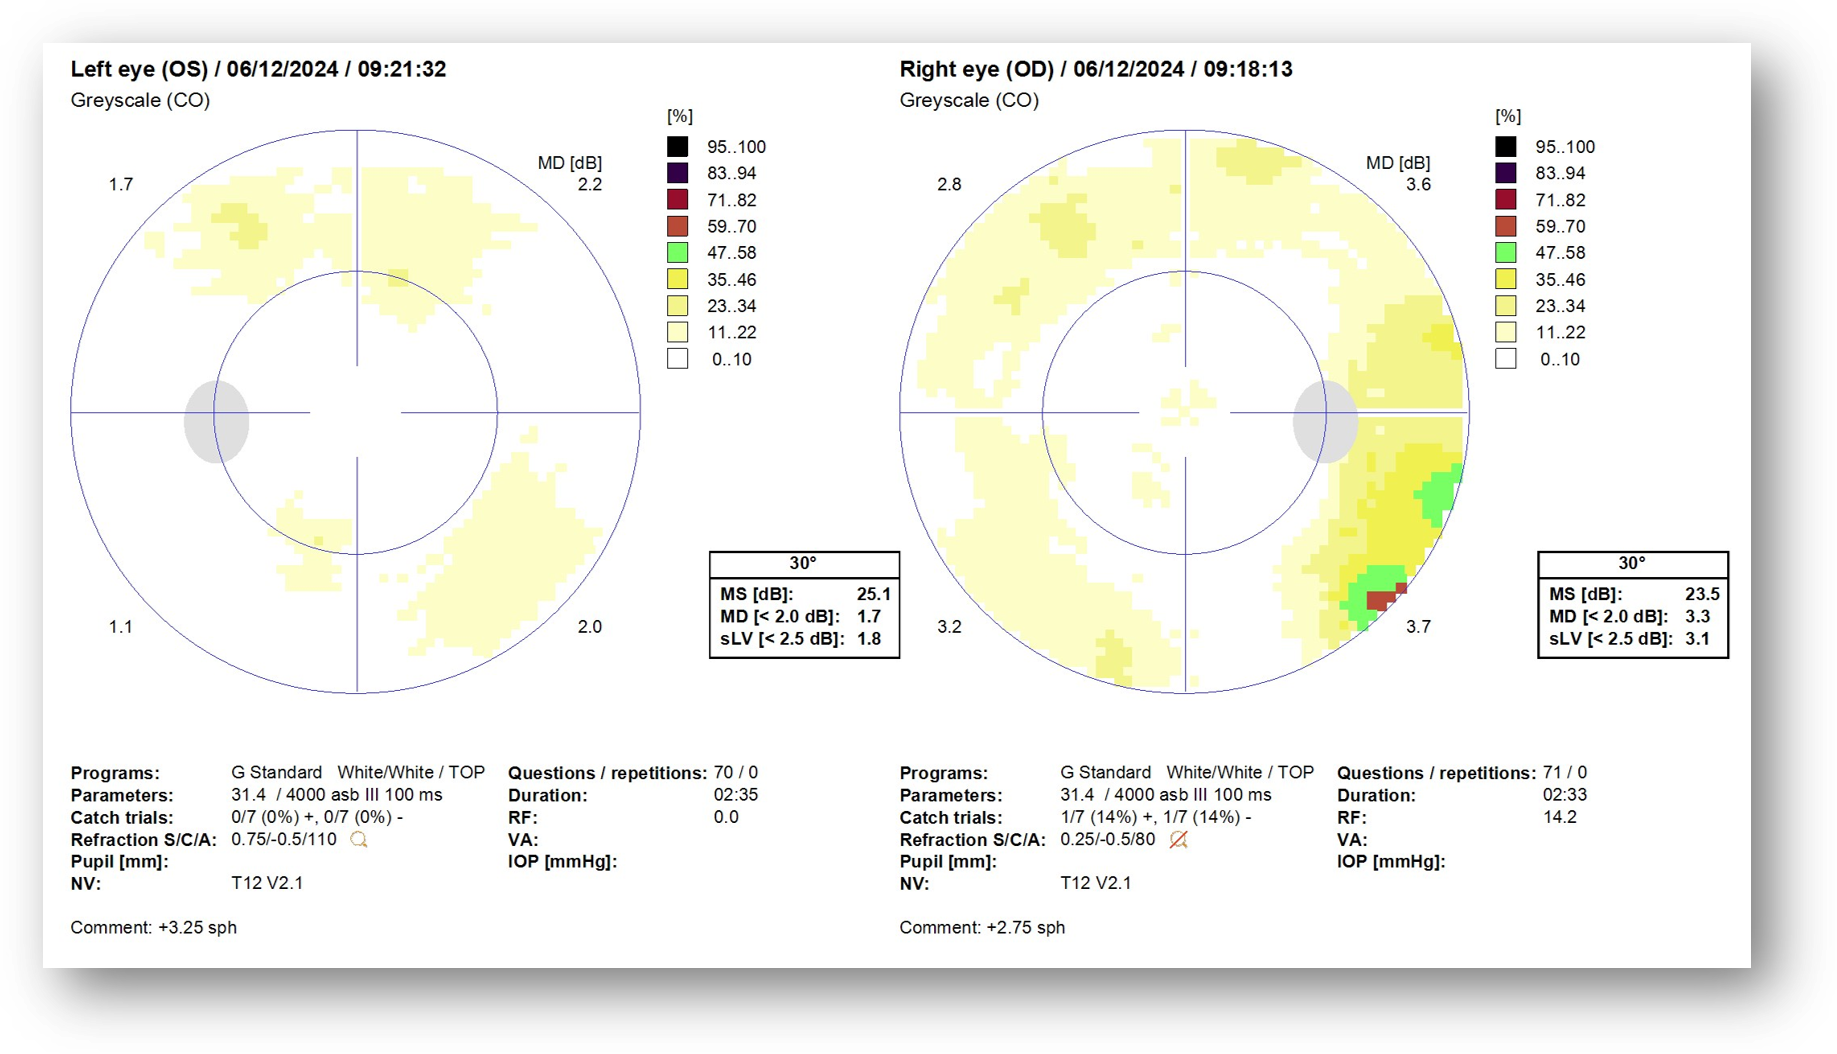
This case represents the complexity and overlap between diabetic retinopathy and hypertensive retinopathy. Wide field imaging revealed mid peripheral and peripheral dot and blot hemorrhages that were a little worse in the left eye than the right (Figure 1a). She also has some AV nicking and some venous beading as well. When we look closely at the optic nerves, we see no obvious asymmetry (Figure 1b); however, when we look at the visual field results, we do see some asymmetry (Figure 2). The patient has a mean defect of 3.3 OD and a mean defect of 1.7 OS.
Figure 1a: Fundus Exam Figure 1b:


Figure 2: Visual Field

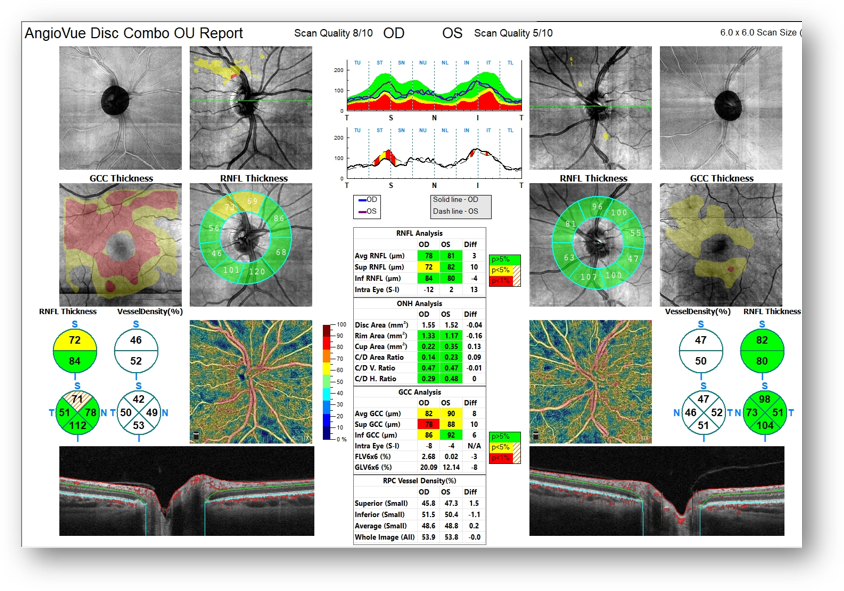
Several things stand out on the OCT/OCT-A report. There’s quite a bit of asymmetry between the right eye and the left eye in the ganglion cell complex report, and there’s also asymmetry between the superior area and the inferior area (Figure 3). The supertemporal area on the nerve fiber layer shows thinning OD on RNFL thickness and TSNIT chart. When you combine this finding with the ganglion cell complex thinning, it raises suspicion.
Figure 3: OCT/OCT-A

When we dig a little deeper into OCT/VF correlation, the visual field polar analysis does not show an expected supratemporal reduction (Figure 4). This indicates structure-function discordance. The OCT-A quadrant view also reveals asymmetry of the superior versus inferior vessel density. The foveal avascular zone, which is greater OD than OS, may indicate some reduction in blood flow (Figure 5).
Figure 4: OCT and Visual Field Polar Axis Figure 5: OCT-A
 A careful angle inspection is also important in all cases of glaucoma and glaucoma suspects. I was able to see scleral spur on gonioscopy. The OCT images show that the angles are open but somewhat narrow (Figure 6).
Figure 6: OCT

Why Was the ERG Performed?
I suspected glaucoma OD, but the structure-function discordance between OCT and visual field made this case a bit more challenging. While there was some visual field asymmetry affecting the right eye more than the left eye, there really wasn’t enough data to convince me that this patient had glaucoma, so I ordered an ERG (Figure 7) to explore whether a functional deficit existed and whether it could be localized to the photoreceptor layer, inner retinal layer, or ganglion cell layer.
What Were the ERG Findings?
We want the amplitude to be strong (i.e., as close to 100% as possible). However, in this patient, the a-wave amplitude is reduced to 10% and 17%. This is most likely due to photoreceptor disruption, resulting in reduced perfusion from a combination of diabetic retinopathy and hypertensive retinopathy. The b-wave was relatively unaffected.
PhNR is a measure of ganglion cell and optic nerve function, and we want the implicit time to be fast (i.e., as close to 0 as possible). In this case, we have 100% in the right eye versus 47% in the left. In terms of amplitude, we have a weak result of 5% in the right eye versus 33% in the left. This asymmetry in the implicit time and amplitude OD indicates ganglion cell and optic nerve dysfunction.
Figure 7: ERG

How Did the ERG Impact Next Steps?
Based on these findings, I made a new diagnosis of hypertensive retinopathy. In addition, I changed her diagnosis from mild nonproliferative to moderate nonproliferative diabetic retinopathy. This decision was made based on the presence of micro aneurysms and venous beading. We always try to correlate structure and function in glaucoma, but the OCT and visual field polar analysis failed to demonstrate that. The ERG, on the other hand, offered objective functional data that helped clinch the diagnosis of primary open angle glaucoma in the right eye. As a result of all the testing combined with the patient’s risk factors, the patient was sent for bilateral SLT.
In sum, I probably would have monitored this patient for 6 months to a year before seeing OCT structural progression and OCT-field concordance. The ERG helped me make the diagnosis earlier.
This case was billed using E11.339 – Type 2 diabetes mellitis with moderate nonproliferative diabetic retinopathy. Other possible codes that could be used include hypertensive retinopathy H35.031 or retinal ischemia H35.82.
Why We Use RETeval
I like objective functional testing because it helps overcome the many weaknesses associated with visual fields.
Practice Protocol
I use the diabetic retinopathy protocol in all patients with diabetes and I use the PhNR protocol to help differentiate retinal and optic nerve disease.

Michael Cymbor, OD FAAO
Nittany Eye Associates (State College, PA)
Dr. Cymbor is a dynamic, engaging clinician and speaker as well as a managing partner of his practice. He lectures frequently on the topics of glaucoma, diabetic retinopathy, macular degeneration, dry eye, and ocular surface disease. He’s a believer that having the right tools – including optical coherence tomography and electroretinography – allow him to better manage eye disease. Dr. Cymbor was included on Newsweek’s Best Optometrists list in 2022.


